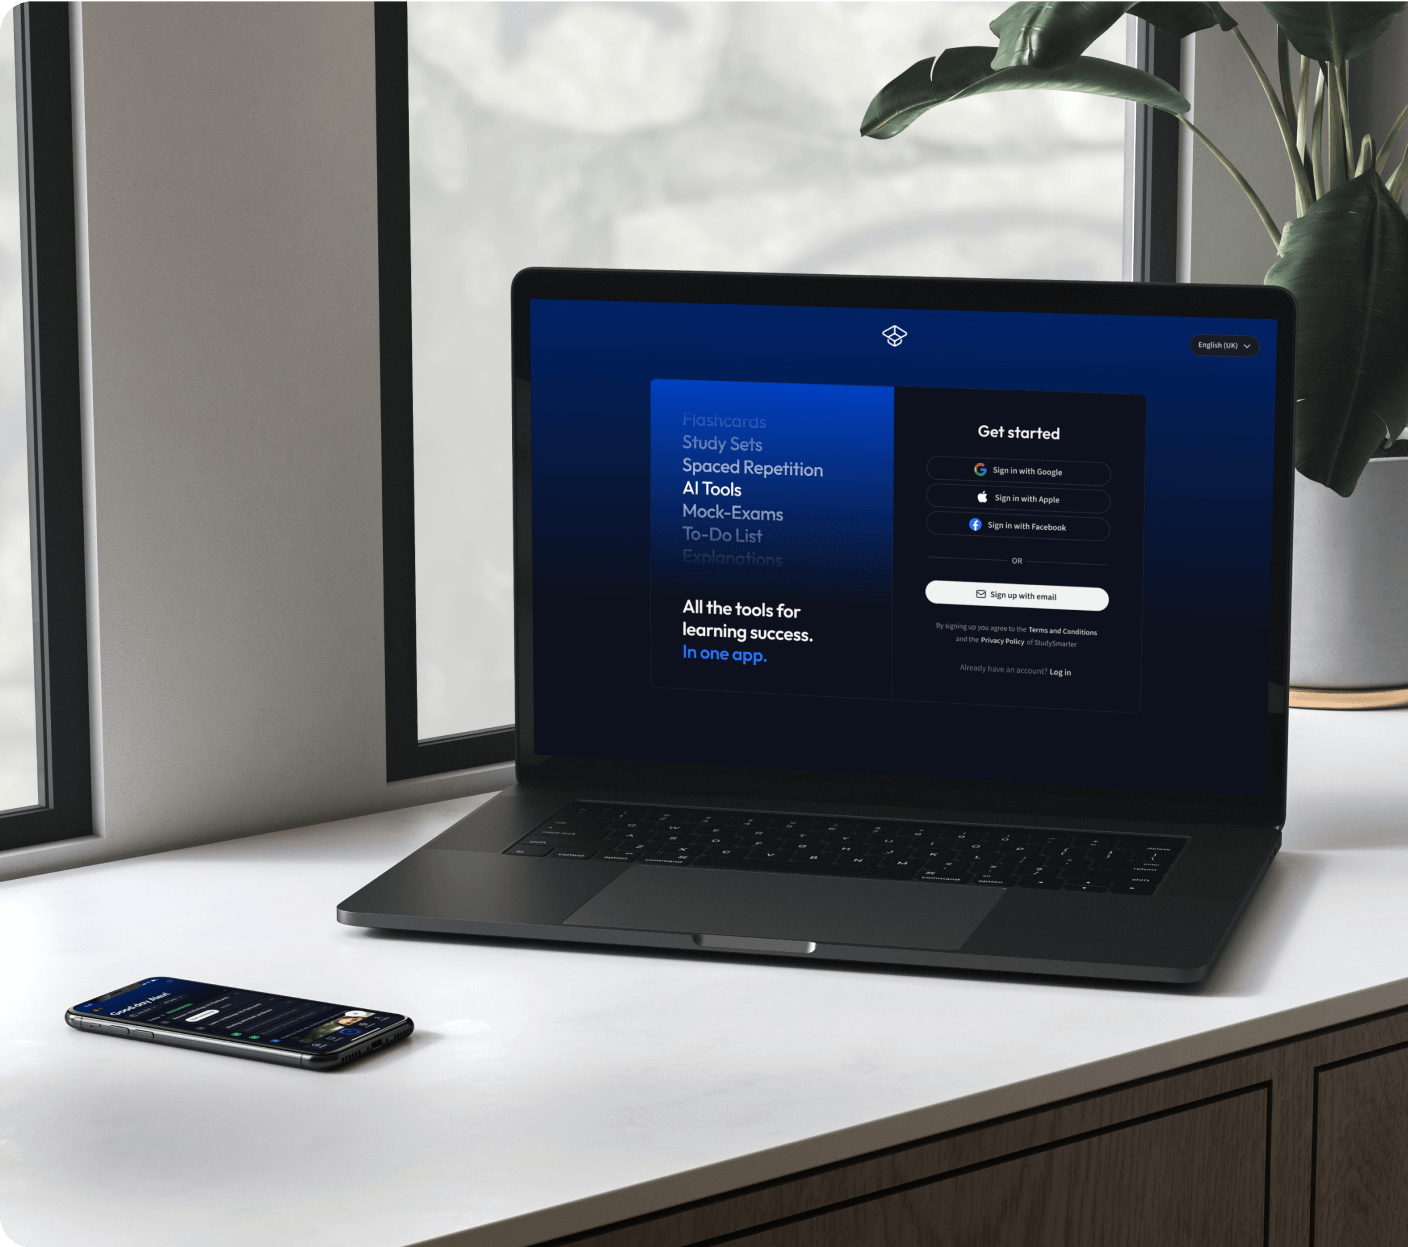
Die all-in-one Lernplattform.
Alle Tools & Lernmaterialien für maximalen Erfolg beim Lernen - in einer App.

22 Millionen +
nutzen StudySmarter
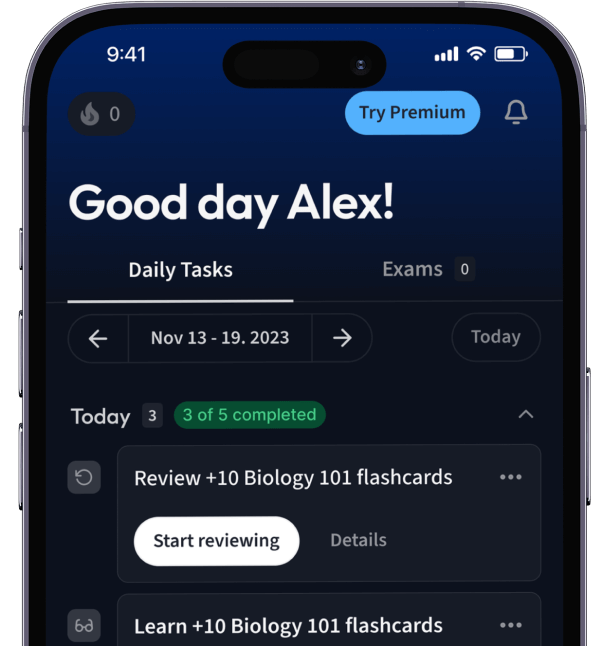
Alles auf einen Blick. Bleib organisiert und motiviert.
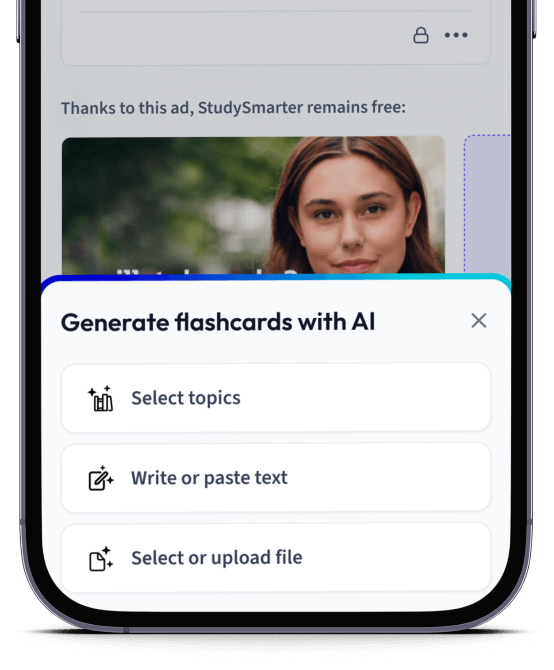
Erstelle Karteikarten in Rekordzeit.
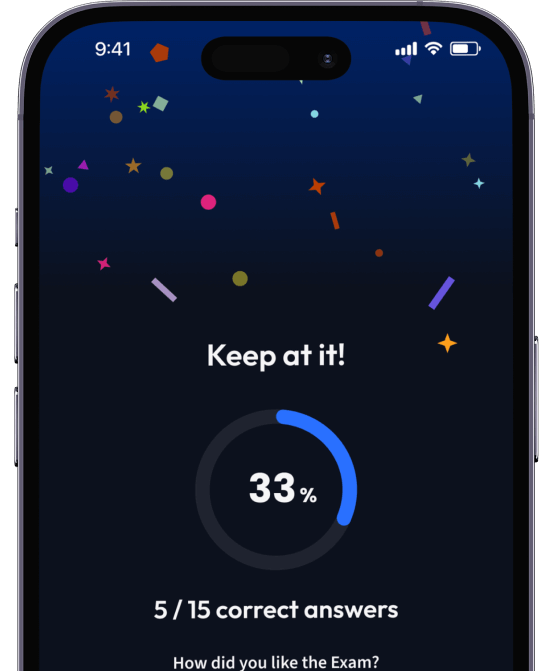
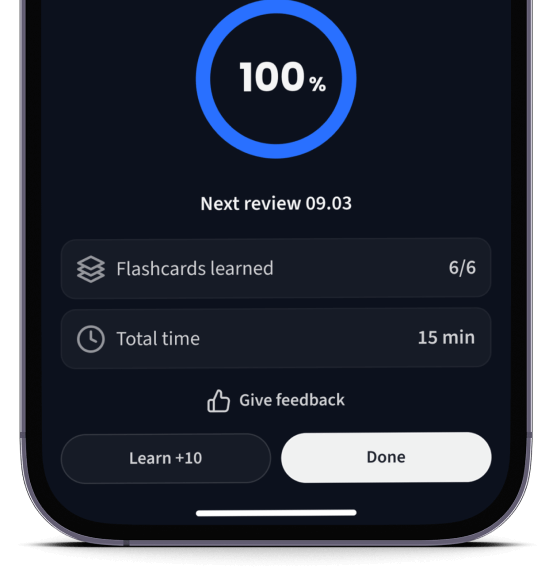
Teste dein Wissen. Erhalte direkt Feedback!
94% bekommen bessere Noten durch unsere smarte Lernplattform.
Kostenfrei loslegenApple liebt unsere App.
Du bestimmt auch!
Lerne von überall mit der kostenfreien StudySmarter App auf iOS & Android.


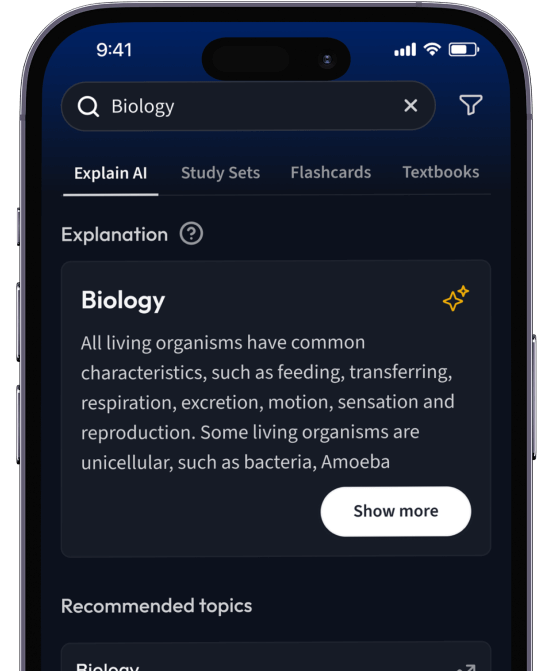
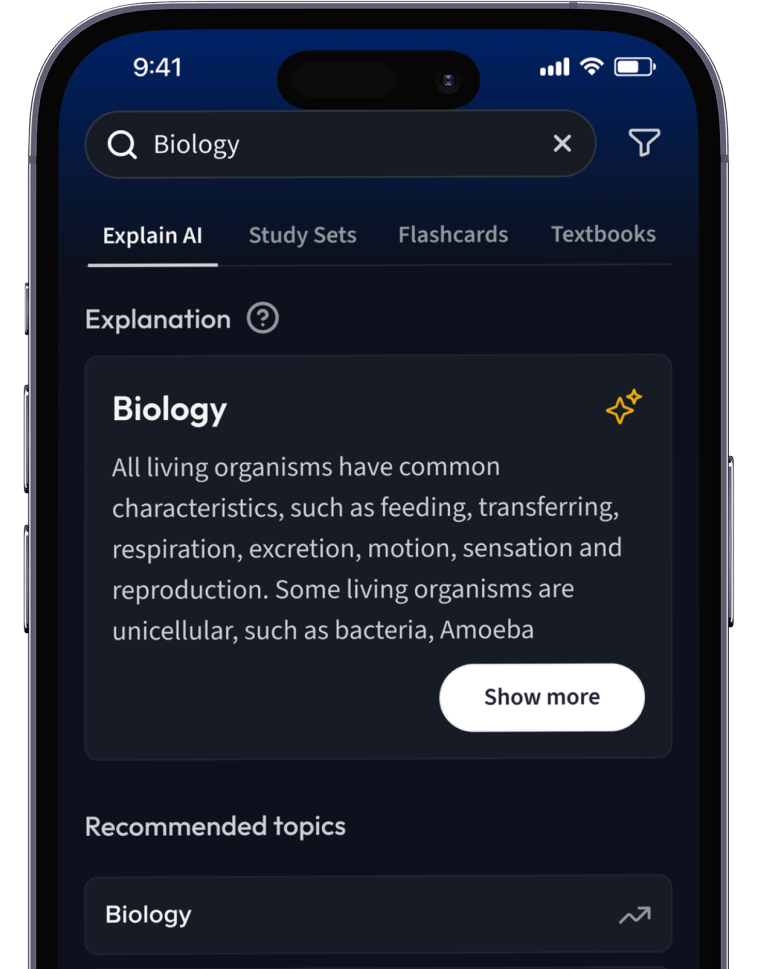
Erhalte Erklärungen zu jedem Thema.
Lerne Karteikarten mit Spaced Repetition.
Lerne auf deinem Handy, Tablet, und Laptop.
Kostenfrei loslegen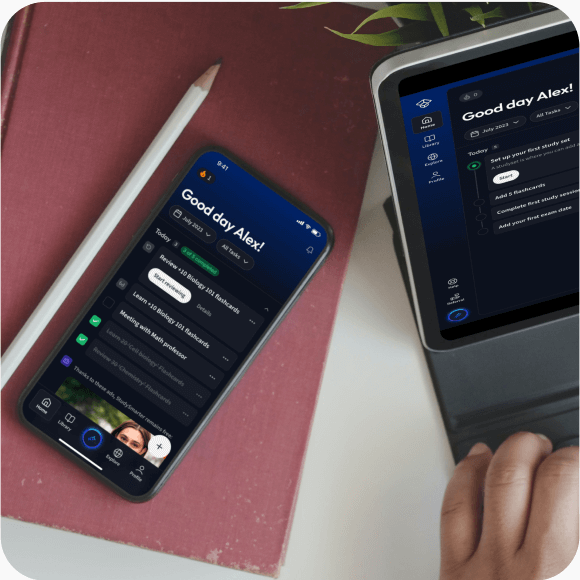
Eine App. Ein Ort zum Lernen.
Lernen mit StudySmarter. Lieben wir!
Die Nr. 1 Lernplattform.
- Direkter Zugriff auf Millionen Lernmaterialien
- Karteikarten, Notizen, Probeklausuren, und mehr
- Alles was du brauchst, um perfekt zu lernen
Lernen auf dem nächsten Level mit AI.
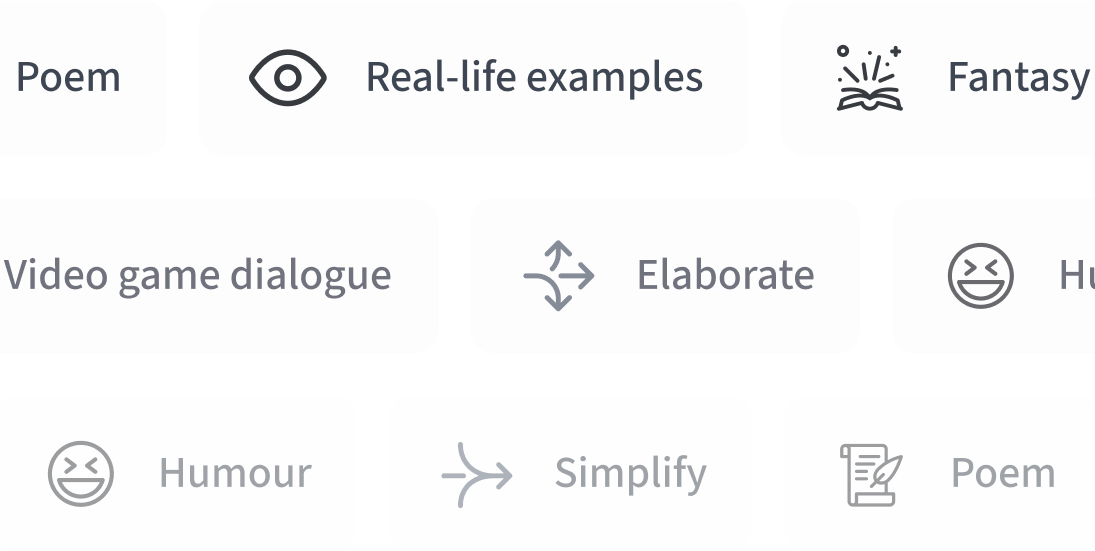
Suche nach einem Thema und lass unsere AI dir personalisierte Erklärungen schreiben.
Lerne wie du willst. Unsere AI passt sich deinem Lernstil an.
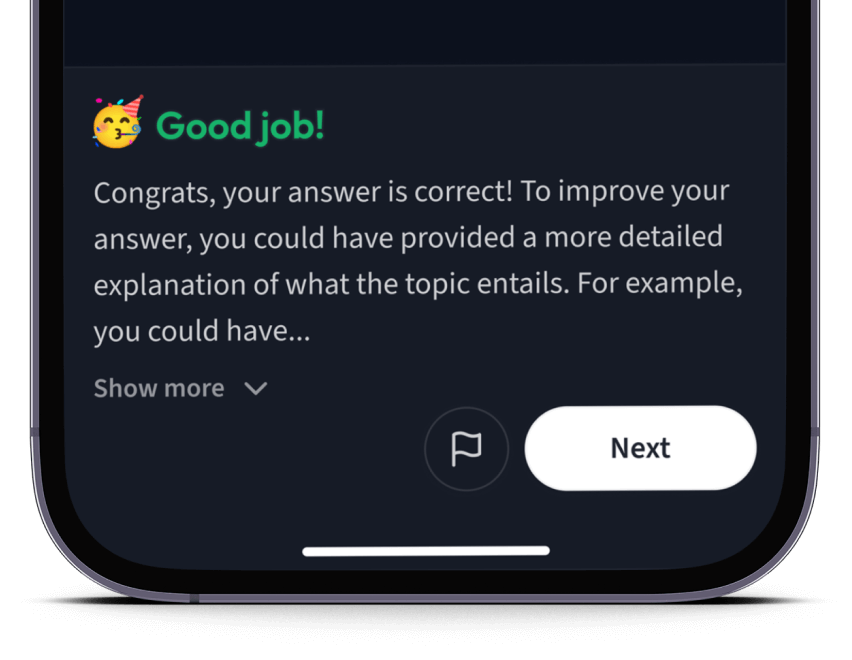
Teste dich mit AI Klausuren und bekomme direktes Feedback.
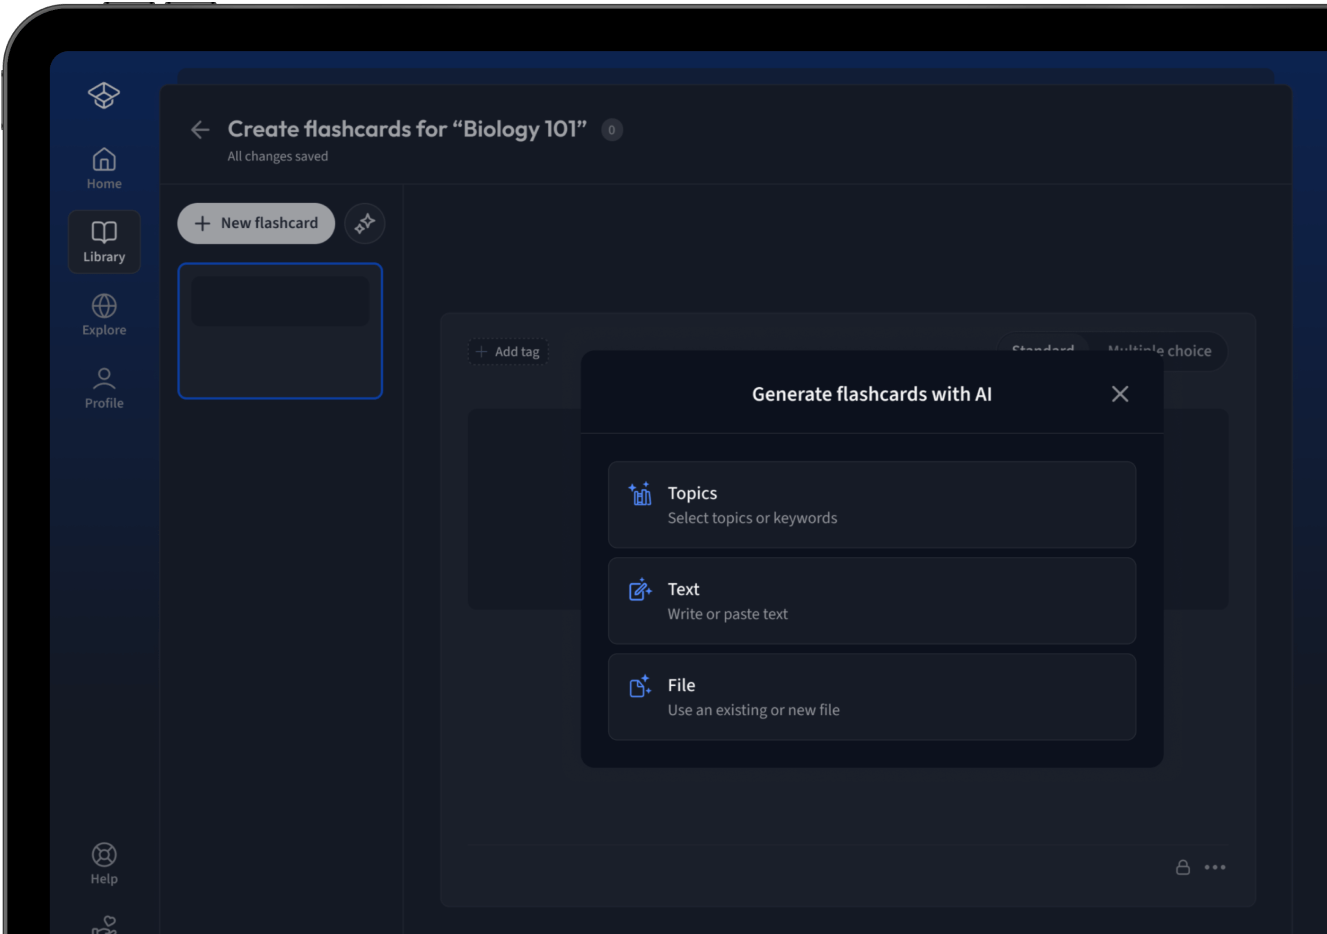
Lade deine Lernunterlagen hoch und lass dir von AI direkt Karteikarten erstellen. Magisch!
Alles was du zum Lernen brauchst. Alles.
Smarte To-Do Liste
Eine vorausgefüllte Checkliste und ein Kalender mit wichtigen Zielen und Prüfungen.
Lernunterlagen
Entdecke Millionen von geteilten Lernunterlagen wie Karteikarten und Notizen.
Karteikarten
Erstelle Karteikarten schneller als je zuvor mit dem fortschrittlichsten Editor.
Notizen
Erstelle schöne Notizen mit unseren Templates. Bearbeite Sie mit unseren smarten Tools.
Quiz Modi
Verstehe alles besser mit wissenschaftlich bewiesenen Lernmethoden.
AI Tools
Unsere AI hilft dir beim Erstellen von Lernmaterialien und gibt dir direktes Feedback.
Probeklausuren
Teste dein Wissen mit unzähligen Probeklausuren und bekomme direktes Feedback.
Erklärungen
Erhalte Erklärungen für jedes Thema, das du lernen möchtest.
Sachbücher
Finde Antworten für jede Frage aus den beliebtesten Sachbüchern.